
PQ curves#
Stations#
All producing stations contain a piecewise linear PQ curve that describes the relationship between the discharge and the generation of the station. The PQ curve is normally given with a reference head.
The PQ-curve should be concave during a standard ProdRisk iteration (forward simulation and backward recursion). That is, the first PQ-segment has the highest efficiency, and the subsequent segments have equal or lower efficiencies than the previous one. If a non-concave PQ-curve is defined by the user, ProdRisk establishes a concave approximation for his purpose by removing non-concave points on the curve. During the final simulation, the default choice is to use the original PQ-curve when finding the total production. In case the original PQ-curve does not have successive lower efficiency with higher discharge, the total production will typically be lower than if we used the concave approximation. In the file prodrisk.CPAR, there is a parameter called PQValg. If PQValg is set to 0, ProdRisk will use the concave approximation in the final simulation. If PQValg is set to 2, the final simulation uses a non-convex PQ curve. In the API, the corresponding attribute is use_non_convex_pq_curve.
The PQ curve is scaled according to the head coefficient, as described in [3]:
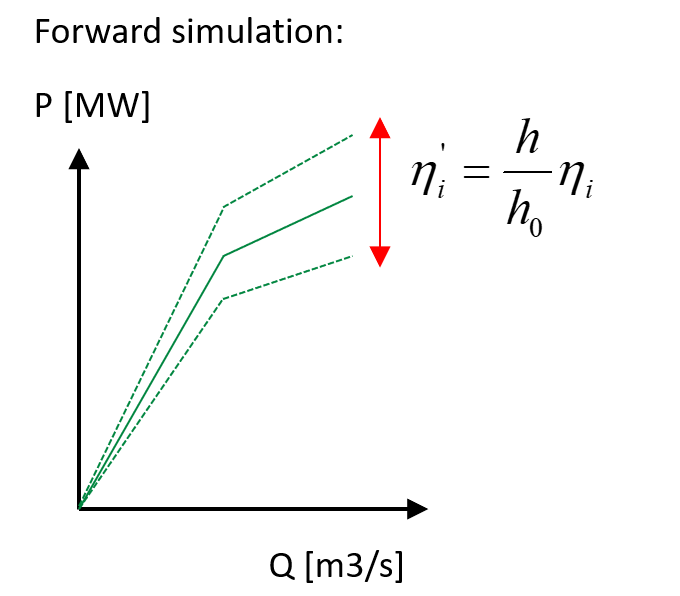
Note that due to the mathematical limitations of the SDDP method, the head coefficient must be equal for each scenario in the strategy calculation. Average reservoir level across scenarios is therefore used to calculate the head coefficient in the strategy calculation. In the final simulation, however, the head coefficient is calculated seperately for each scenario.
Pumps#
There is no PQ curve for pumps: as the power usage is modelled as a constant, but the flow is dependent on the water head and subject to the same head update as all other Prodrisk head dependencies.