Results from Prodrisk#
In this example, we will introduce different ways of extracting output from Prodrisk and demonstrate use of these methods.
Extracting results from PyProdrisk#
When using PyProdrisk, results are obtained through output attributes by calling the function .get(). A complete list of attributes, including their data types and input/output classification, can be found in Attributes. An example is shown in PyProdrisk: Basic example, where several results are extracted from a PyProdrisk run.
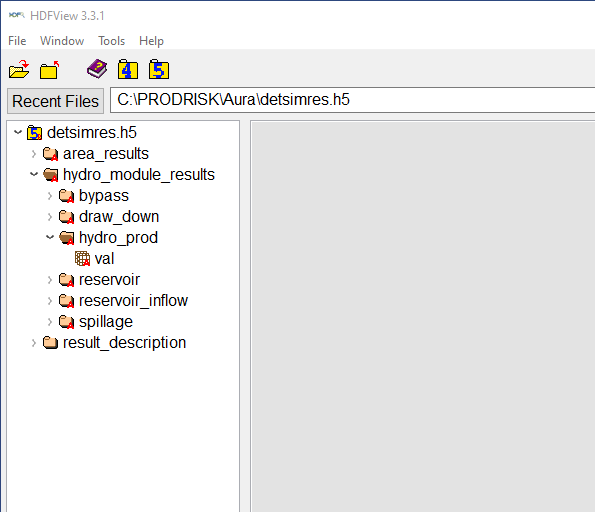
Reading directly from result files#
The Prodrisk results can be found in the the result files detsimres.h5 and enmres.h5. detsimres.hs can provide results per module or per area, whereas enmres.h5 can give results for the whole area only. Both can be viewed using an interfacing program like HDFView, or accessed directly using e.g. python.

Here is a basic example of how the income for the total system can be found using python.
import numpy as np
import matplotlib.pyplot as plt
import h5py

folder_path = r"C:\PRODRISK\Aura"
nscenarios = 58
nweeks = 156

with h5py.File(folder_path + r'\detsimres.h5','r') as f:
        production = np.array(f['area_results']['hydro_prod']['val'])                   # resolution of price periods, GWh
        reservoir = np.array(f['area_results']['reservoir']['val'])                     # Weekly values, GWH

with h5py.File(folder_path + '/enmres.h5','r') as f:
        price = np.array(f['market_results']['price']['val'])                           # Øre/kWw

income = 0
endReservoir = 0
startReservoir = 0
for s in range(nscenarios):
    for w in range(nweeks):
        for d in range(7):
            income = income + production[s,0,w*7+d]*price[0,s,w]/100                    # GWh*NOK/kWH = MNOK
    endReservoir = endReservoir + reservoir[s,0,nweeks-1]*np.average(price[0,s,:])/100  # MNOK
    startReservoir = startReservoir + reservoir[s,0,0]*np.average(price[0,s,:])/100
adjustedIncome = (income+(endReservoir-startReservoir))/nscenarios                      # MNOK/år
income = income/nscenarios                                                              # MNOK/år


print("Average income:")
print(income)
print("Average adjusted income:")
print(adjustedIncome)
print("Average price: ",np.average(price[:,:,:]))
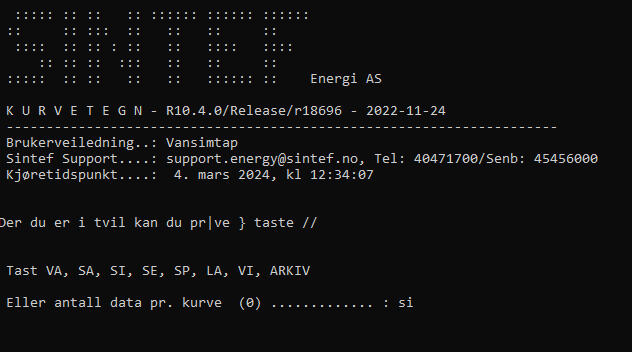
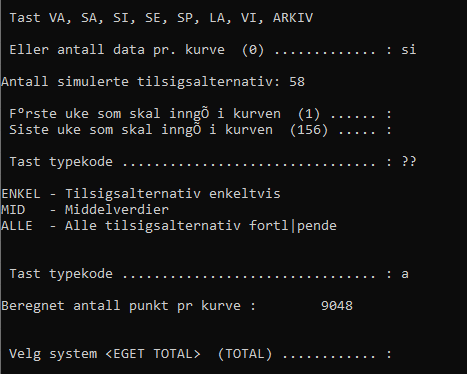
Using Kurvetegn#
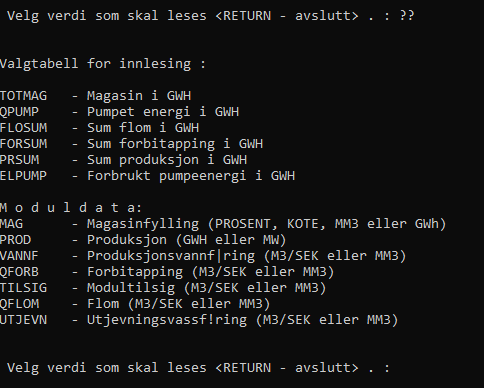
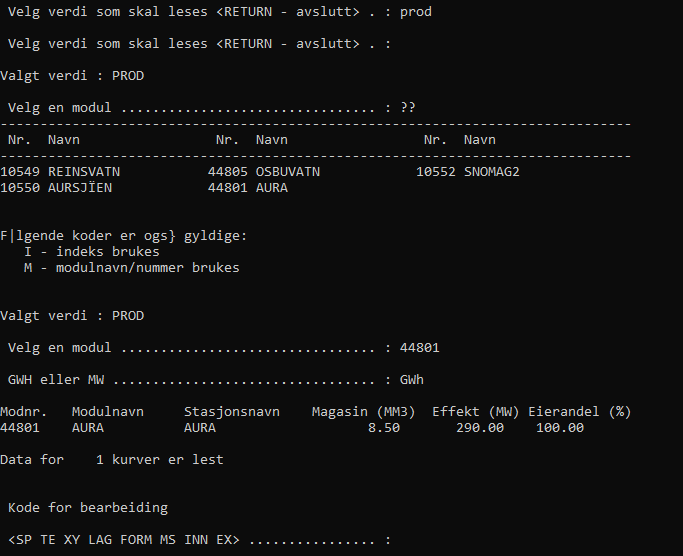
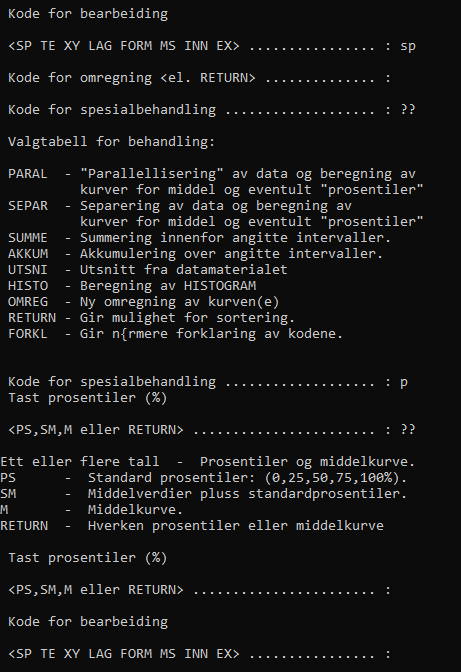
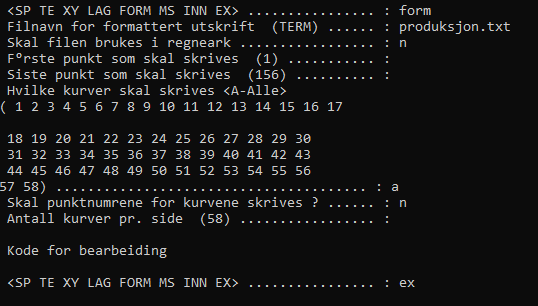
Alternatively, the price, production and reservoir volumes can be extracted using the kurvetegn program. For more information about kurvetegn, we refer to LTM documentation. Within Kurvetegn, you are presented with menus where you must choose the option you prefer. The option VA will give results from the whole system, whereas the option SI can give you results from the modules.
Here is a basic example of how to extract production data for one module using Kurvetegn.exe.
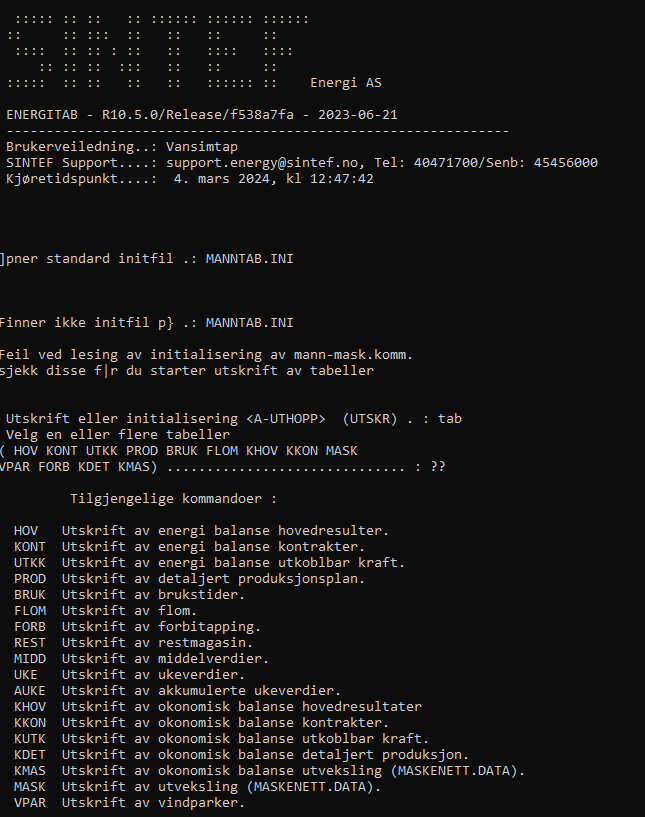
Using the ET program#
Another useful program is the ET program. It gives you already processed energy, market- or hydropower results in a table form. For more information about ET, we refer to LTM documentation.